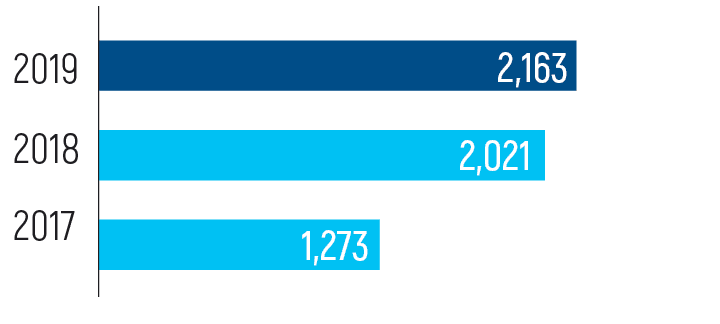
Capital expenditures based on accrued basis,USdmln
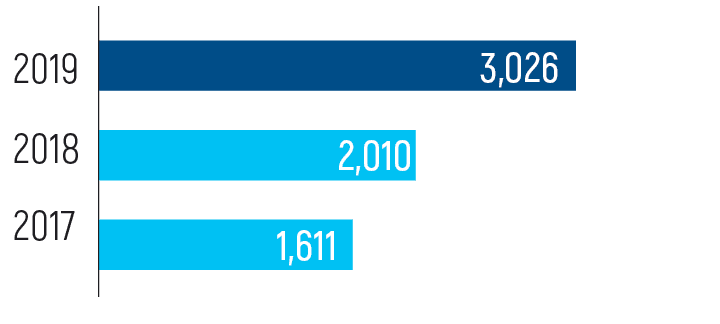
Capital expenditures based on cash basis,USdmln
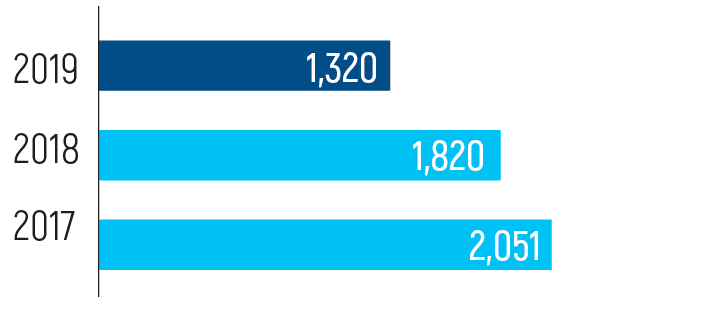
Free cash flow,USdmln
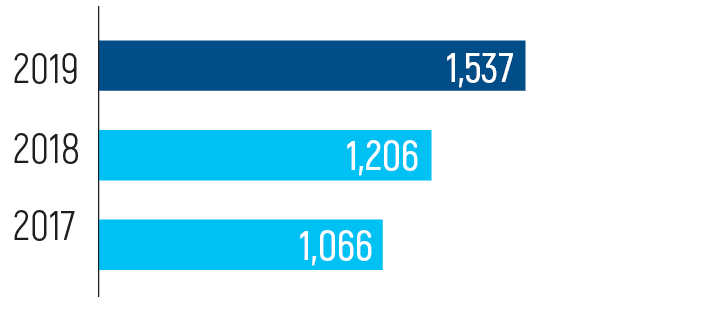
Net debt,USdmln
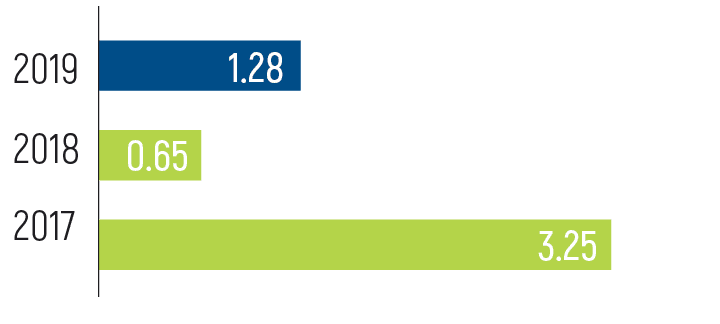
Net debt/EBITDA, x
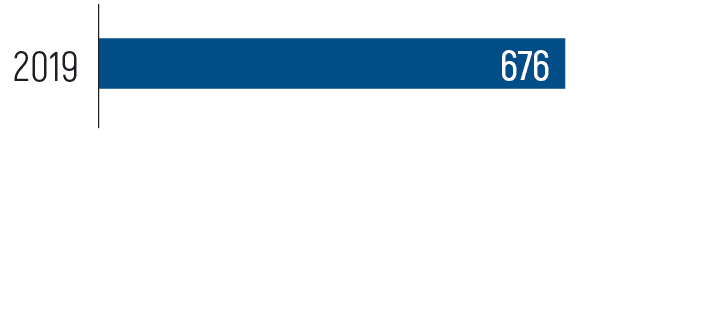
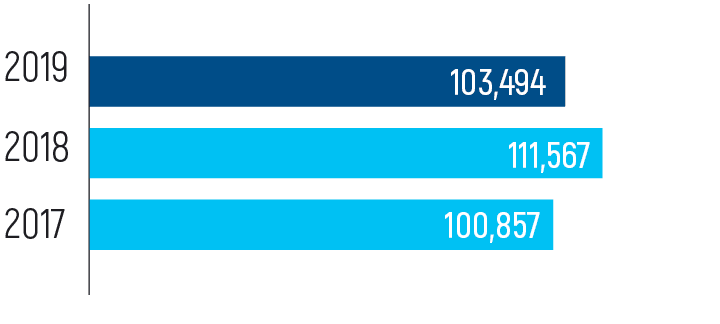
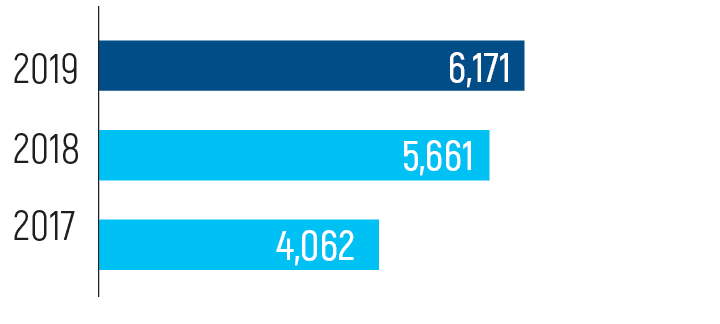
Social highlights
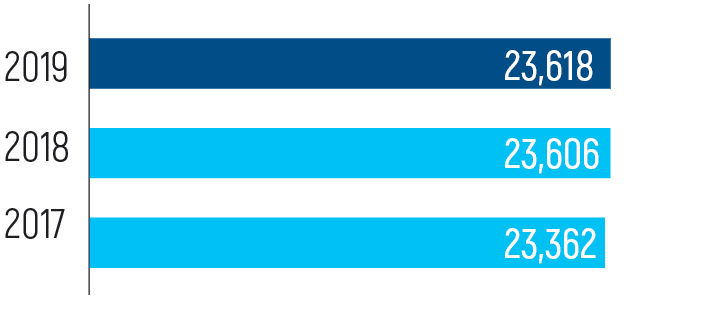
Actual number ofemployeesFrom 2019 the Company revised the methodology to calculate the Actual number of employees (calculation includes employees from the companies with share of 50%and more). Figures for previous periods were also recalculated.
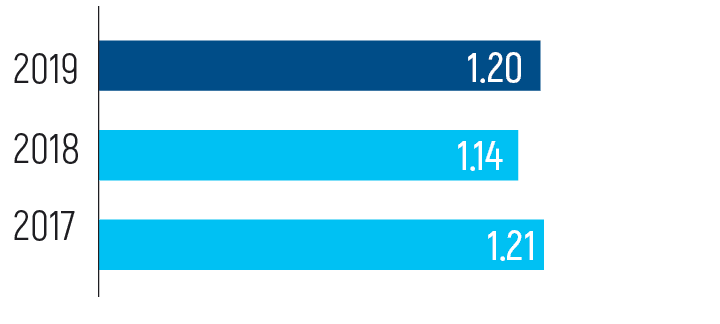
Lost Time Incident Rate (LTIR), PER 1MLNMAN-HOURS
Fatal accident rate (FAR), PER 100MLNMAN-HOURS
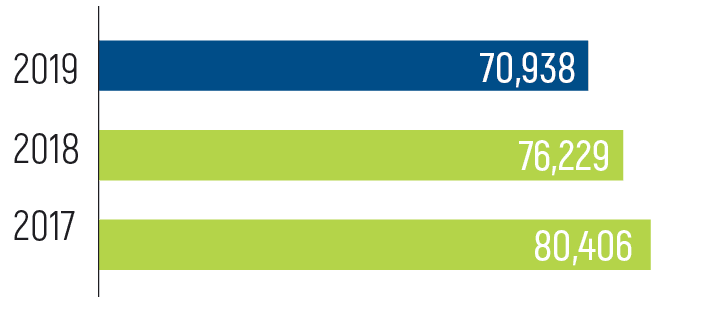
Environmental highlights
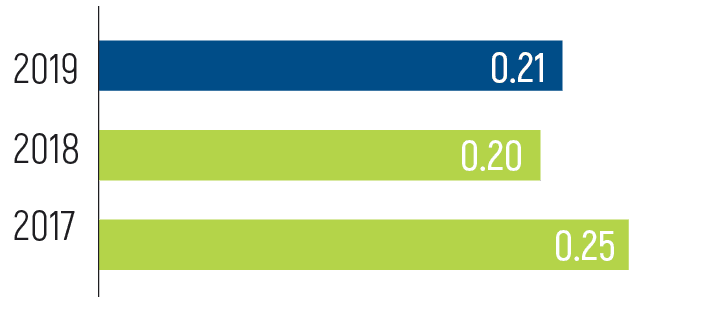
NOXemissions, tonnes per 1,000 tonnes of produced hydrocarbons
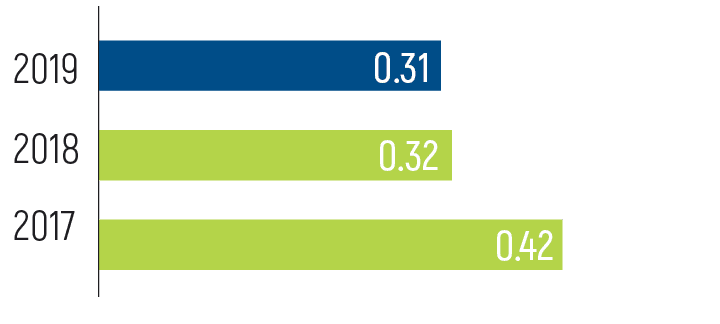
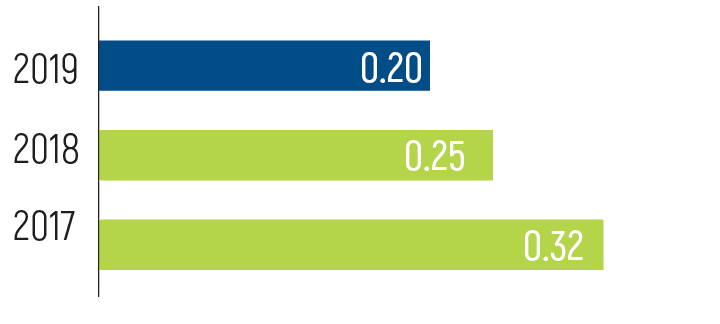
SOXemissions, tonnes per 1,000 tonnes of produced hydrocarbons
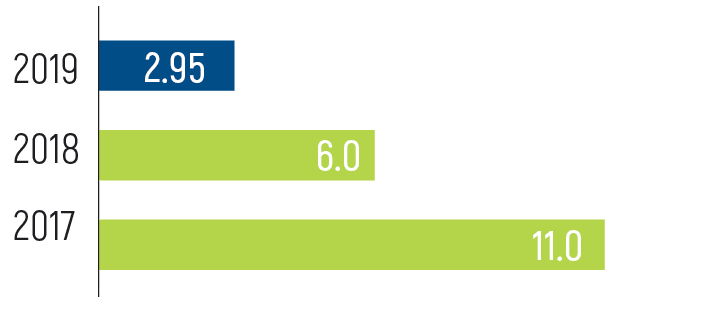
APG flaring rate, tonnes per 1,000 tonnes of produced hydrocarbons